RWEPA | R - shiny企業實務應用
第4集-shiny銷售儀表板
- 按 訂閱、讚、開啟小鈴鐺
- https://youtube.com/@alan9956
- http://rwepa.blogspot.com/
![]()
Business Data Analytics 
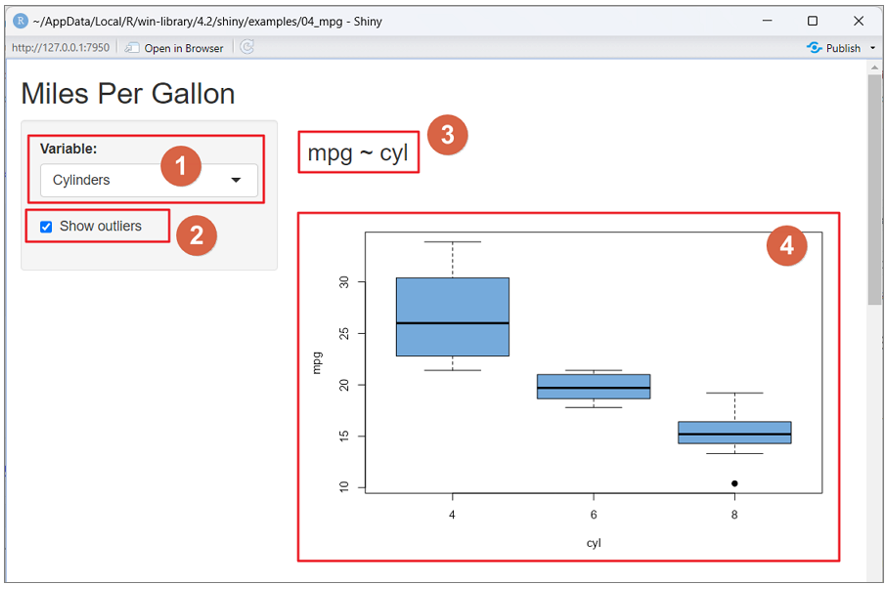
4.1 範例_runExample(“04_mpg”)
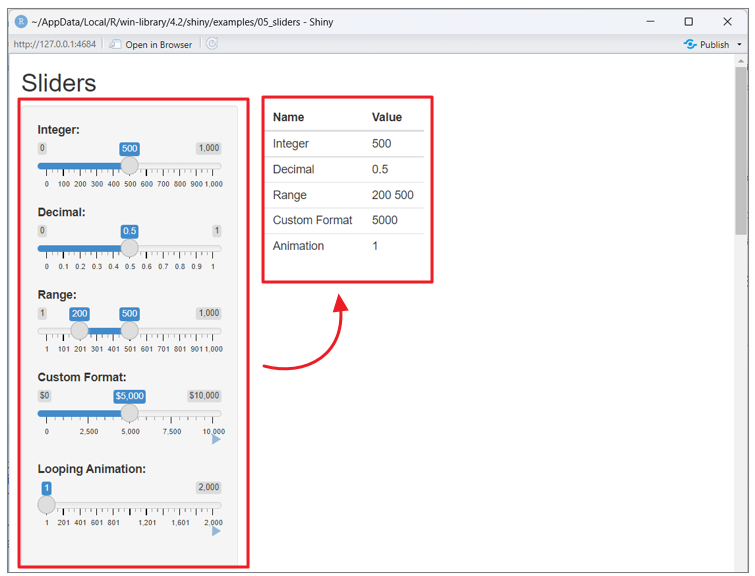
4.2 範例_runExample(“05_sliders”)
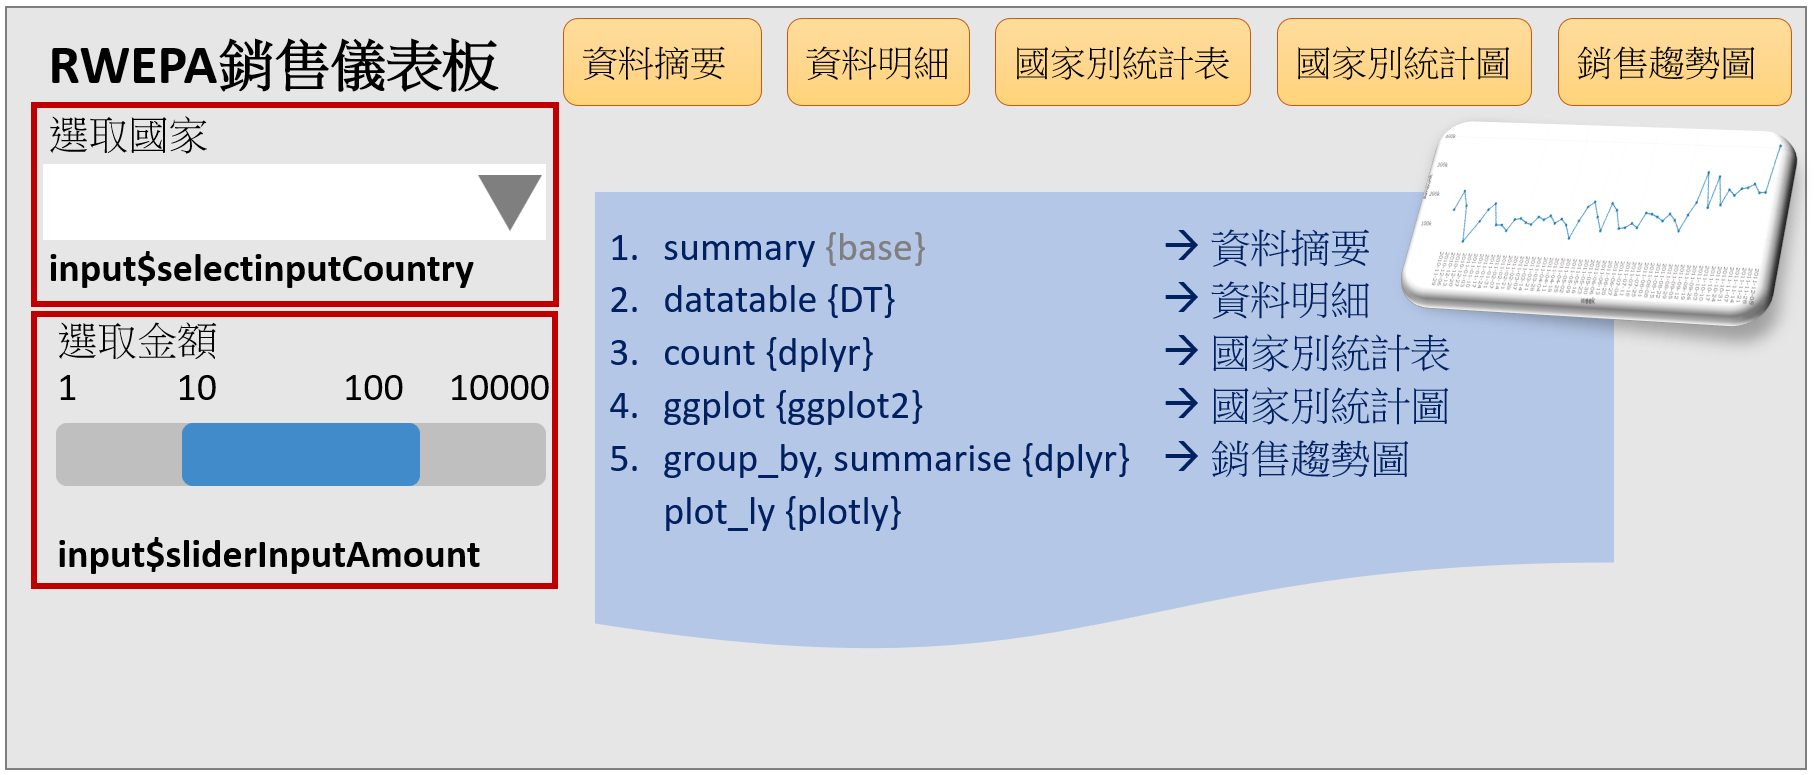
4.3.2 shiny銷售儀表板-手繪版
4.3.3 Shiny Widgets Gallery

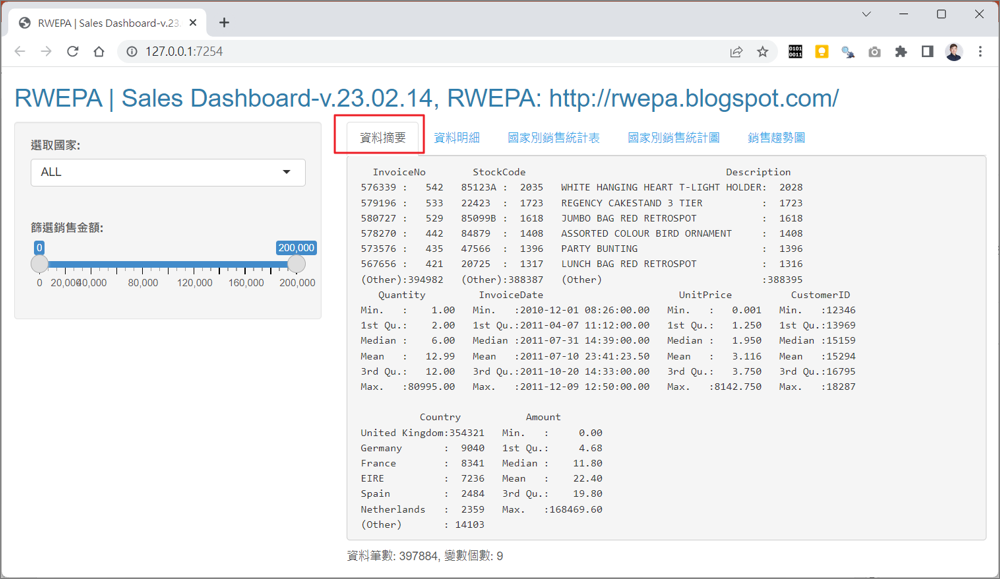
4.4 shiny銷售儀表板-完成版(1/5)
- 資料摘要
![]()
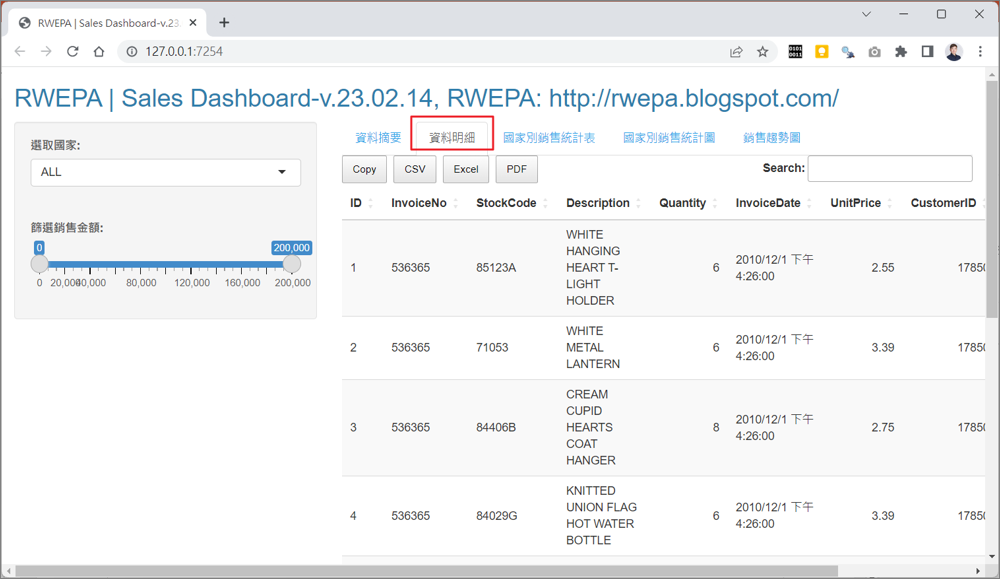
資料明細(2/5)
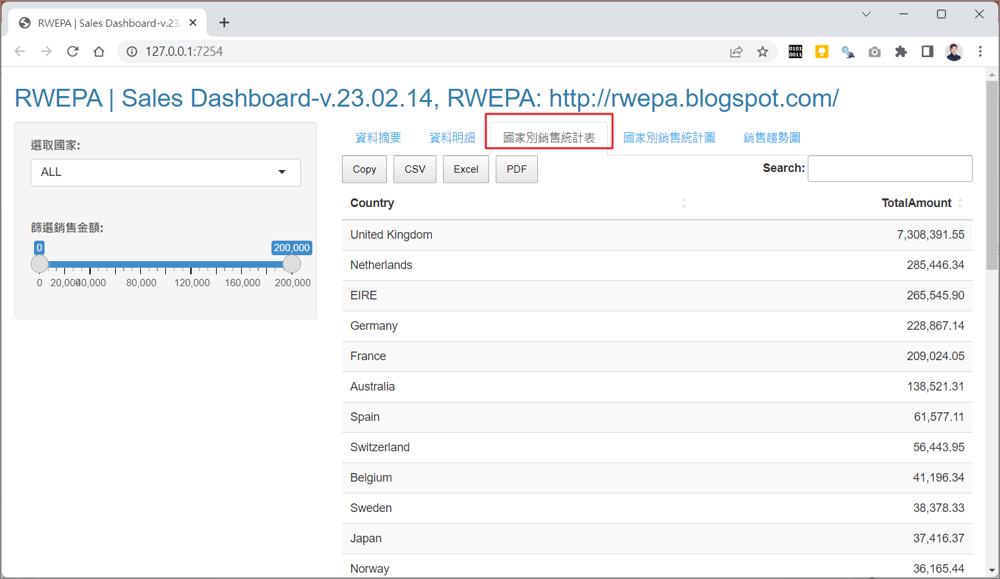
國家別銷售統計表(3/5)
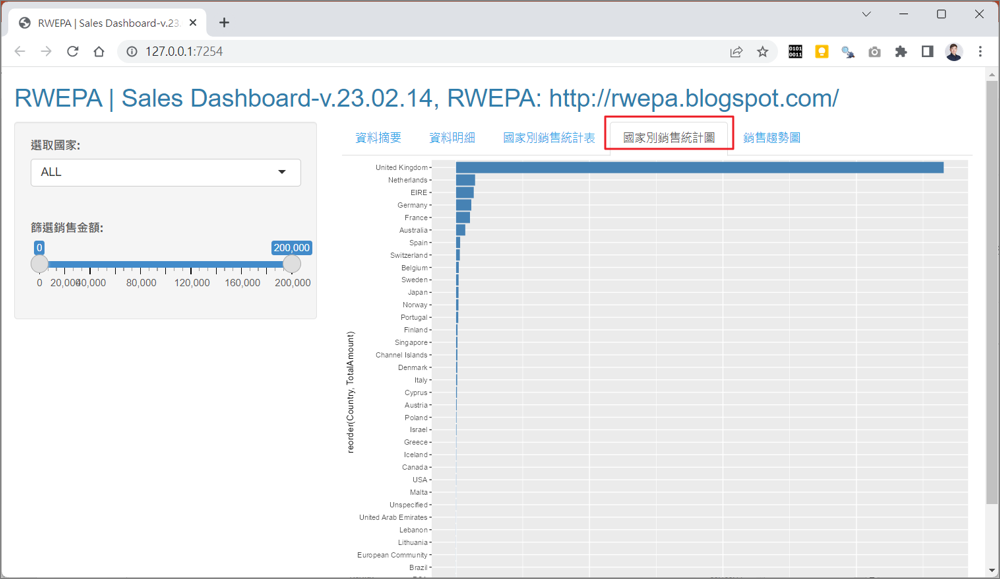
國家別銷售統計圖(4/5)
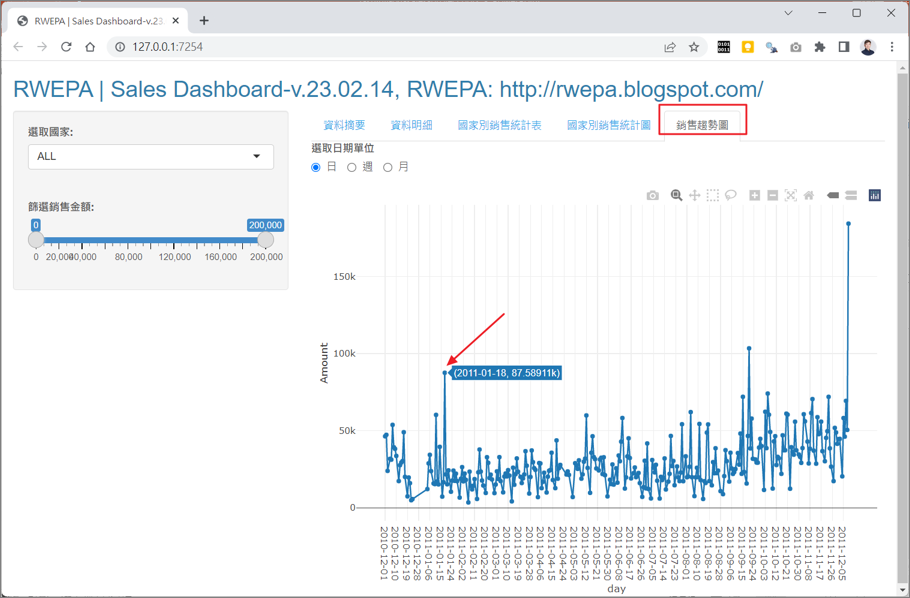
銷售趨勢圖(5/5)
shiny銷售儀表板
程式碼 https://github.com/rwepa/business_analytics/tree/main/r-shiny-04-sales-project/r-code
加強R基礎與進階能力【附資料集、程式碼、中文字幕】 https://mastertalks.tw/products/r?ref=MCLEE

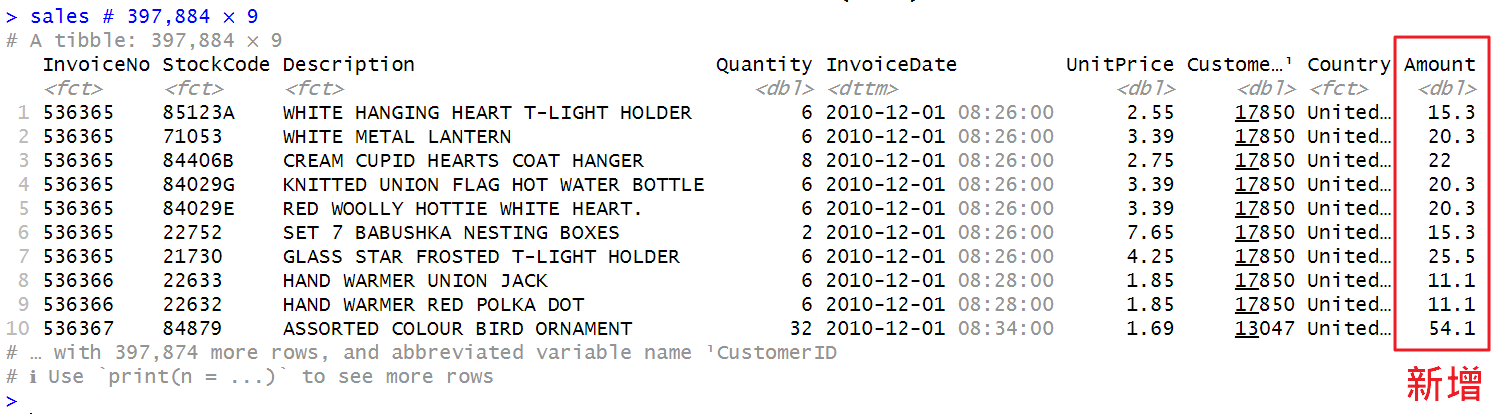
shiny銷售儀表板-sales資料物件
sales資料物件結果
![]()
ui, server解說